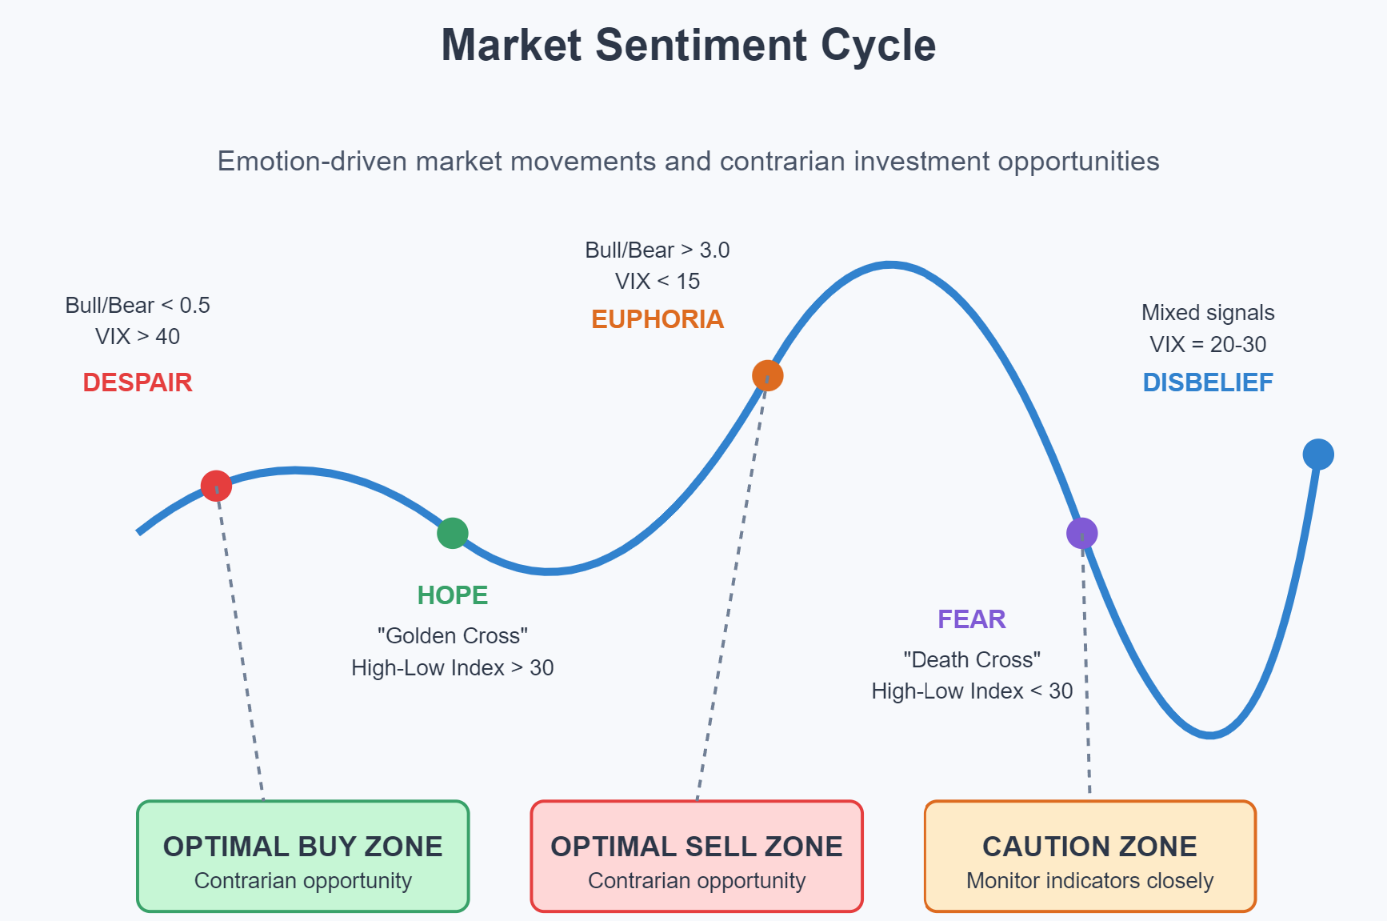
Financial markets do not operate solely based on numbers—emotions and crowd psychology also drive them. Market sentiment reflects the collective mood of investors and significantly influences asset price movements. How exactly does this psychological aspect of markets work? Which market sentiment indicators help traders predict trend changes? And how can you use this information to make your own investment decisions?
Understanding market sentiment means gaining a significant advantage over other investors. When you can detect changes in mood before the crowd, you can make more informed decisions and avoid costly mistakes.
The Essence of Market Sentiment
What is market sentiment? Simply put, it is the overall attitude of investors towards a specific stock, sector, or the market as a whole. This collective opinion is reflected in trading activity and price movements:
- rising prices generally indicate a bullish (optimistic) sentiment,
- while falling prices signal a bearish (pessimistic) sentiment.
Interestingly, these moods are often unrelated to the economic fundamentals of the asset or market being observed but are rather a reflection of the emotional state of investors. To better understand the significance of sentiment indicators read this article from Semantic Visions, learn how these tools truly help identify the market’s actual mood.
The two main psychological factors shaping market sentiment are fear and greed. Greed drives investors to buy regardless of fundamental value, while fear triggers a panic sell-off. These emotions are spread by crowd psychology—when we see others buying, we tend to follow, just as we do when selling. This often leads to exaggerated reactions and the creation of market bubbles or, conversely, unnecessary deep declines.
At the same time, market sentiment is not static—it changes over time in response to new information, economic data, or even geopolitical events. It is this dynamic nature that makes market sentiment analysis such a valuable tool for traders looking for an edge in highly competitive markets.
Main Indicators for Measuring Market Sentiment
To effectively measure the mood of the market, a range of specialized tools has been developed. These market sentiment indicators provide a quantifiable view of the otherwise abstract emotions driving the markets. The most commonly used ones include the following.
VIX—The Fear and Greed Index
The CBOE Volatility Index, known as the VIX or the “fear index,” measures the implied volatility of options on the S&P 500 index. High VIX values (above 30) indicate increased fear among investors, often signaling a potential market bottom. Conversely, low values (below 20) suggest excessive confidence and warn of a possible correction. You can find more about VIX in this article.
Bullish vs. Bearish Sentiment Ratio
This indicator tracks surveys among investors and measures the percentage of optimistic (bullish) and pessimistic (bearish) views. An extremely high ratio of bulls to bears often signals excessive optimism and a potential market peak. Interestingly, this indicator works best as a contrarian tool—when “everyone” expects growth, caution is often warranted.
High-Low Index
The High-Low Index compares the number of stocks that have reached 52-week highs with the number of stocks at 52-week lows. Values below 30 indicate prevailing pessimism and a potential buying opportunity. Conversely, an index above 70 signals excessive optimism and a possible risk of a market correction.
Moving Averages
Investors often use the 50-day and 200-day moving averages to determine the trend of sentiment. When the 50-day average crosses above the 200-day average, it forms a so-called “golden cross,” which indicates a change in momentum upwards and increasing optimism. The opposite signal, the “death cross,” occurs when the 50-day average crosses below the 200-day average and typically signals a deterioration in market sentiment.

Practical Use of Market Sentiment in Investment Strategies
So how can market sentiment analysis be effectively used in practice? Experienced traders often use sentiment as a contrarian indicator—they invest against the prevailing opinion when it reaches extreme levels. When most investors are gripped by panic, it’s time to buy. Conversely, when everyone is celebrating, it’s a good time to consider reducing positions.
For long-term investors, extremely negative market sentiment typically presents an opportunity to buy quality stocks at more favorable prices. Warren Buffett captured this strategy with his famous quote: “Be greedy when others are fearful; be fearful when others are greedy.”
Day traders, on the other hand, use market sentiment indicators to identify short-term trading opportunities when sentiment reaches extremes, and a trend reversal is imminent. In this approach, market sentiment acts as an early warning of a potential turnaround.
However, keep in mind that no sentiment indicator is infallible. The best results come from combining multiple tools and comparing their signals with fundamental and technical analysis. It is this combination of approaches that makes sentiment analysis a truly powerful tool for investors of all experience levels.

